jvqplot
A simple data plotting program
Introduction
Jvqplot is a data plotting program, resembling a simplified version of gnuplot. It is very simple to use, but it can only plot simple data files. The format and scaling of the plot are automatically chosen and cannot be changed. One of the main features of jvqplot is that the plot is automatically updated whenever the data in the input file changes.
Usage
Jvqplot can plot data from files. The input file must consists of numbers, arranged in columns. The first column corresponds to the horizontal axis. For each of the remaining columns a line is plotted which displays the corresponding values on the vertical axis.
If the data is contained in the file fname, you can call jvqplot from the command line as follows:
jvqplot fname &
Afterwards, whenever you change the contents of fname, the plot will automatically be updated. Clicking the right mouse button on the plot window brings up a context menu which allows to print the plot and to quit the program. See the included jvqplot manual page for more details.
Download
Jvqplot is free software, the source code is available below. You are free to change and redistribute it under the terms of the GNU General Public License, version 3 or later.
github: seehuhn/jvqplot
| Version | Date | Download | Notes |
|---|---|---|---|
| 0.2 | 2012-04-09 | tar.gz (166 KB), sig, sha1cebb02849f6743babf6cf2a52a1098328ad374f6 |
|
| 0.1 | 2010-11-29 | tar.gz (95 KB), sig, sha1025b1e96eff5f8f57c8d78f30a612c15d36e6780 |
experimental version |
More recent, experimental versions of the jvqplot source code may (or may not) be available on github.com.
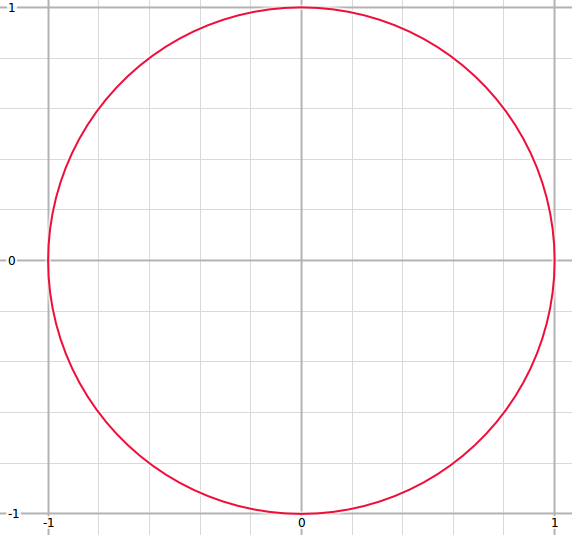
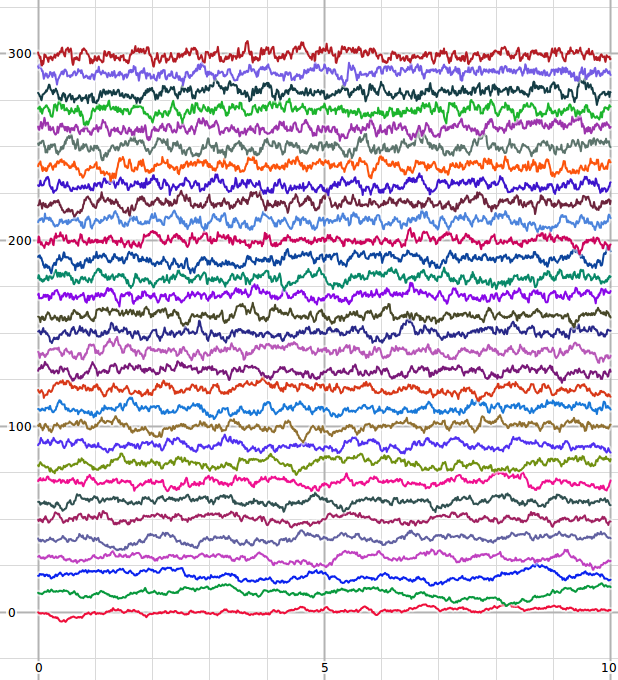
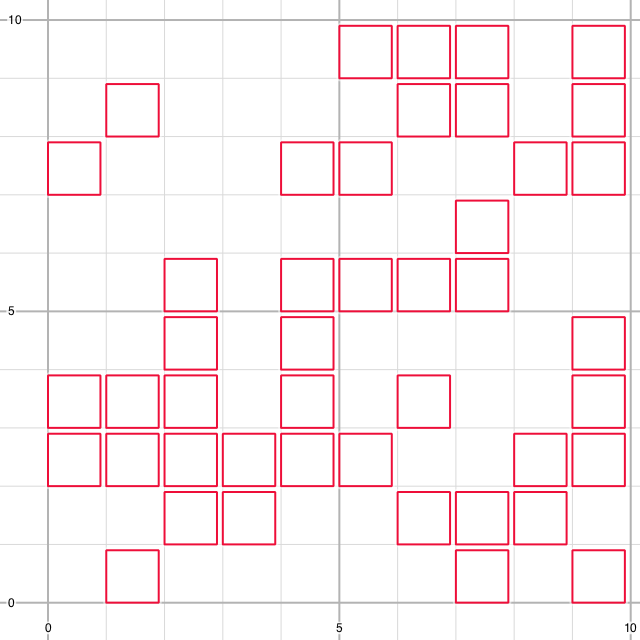
Gallery